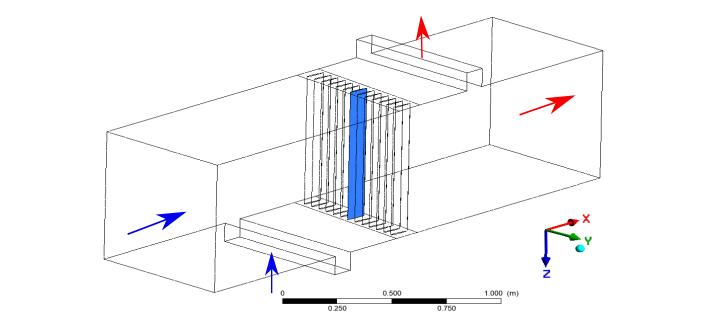
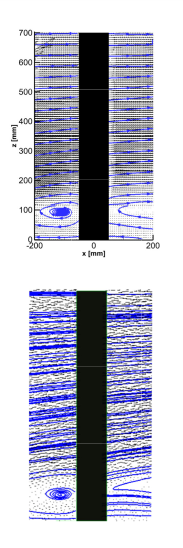
Figure 1 – Comparison of velocity vector fields and streamlines (CFD vs. PIV)
To validate the numerical data, Particle Image Velocimetry (PIV) was employed in both horizontal and vertical planes. This experimental measurement captured complex flow phenomena, such as blade root separation vortices. Results showed a strong agreement between CFD and PIV data, although CFD slightly underestimated the size of separation vortices at specific bypass velocities (5–10 m/s).
After validating the flow filed around blade cascade with PIV measurements, in the next step aerodynamic force one the cascade blades evaluated in the CFD numerical model. At this stage only steady state CFD simulations are carried out to evaluate the forces on the blades along with the flow field. In Figure 2 the aerodynamic force (y-direction) on the mid blade is presented. The y-component of force is representative of the lift-force on the blades. In Figure 2, the aerodynamic forces one suction side (SS) and pressure side (PS) for 5m/s inlet velocity (V) and three different bypass velocity 0m/s, 5m/s and 10m/s respectively.
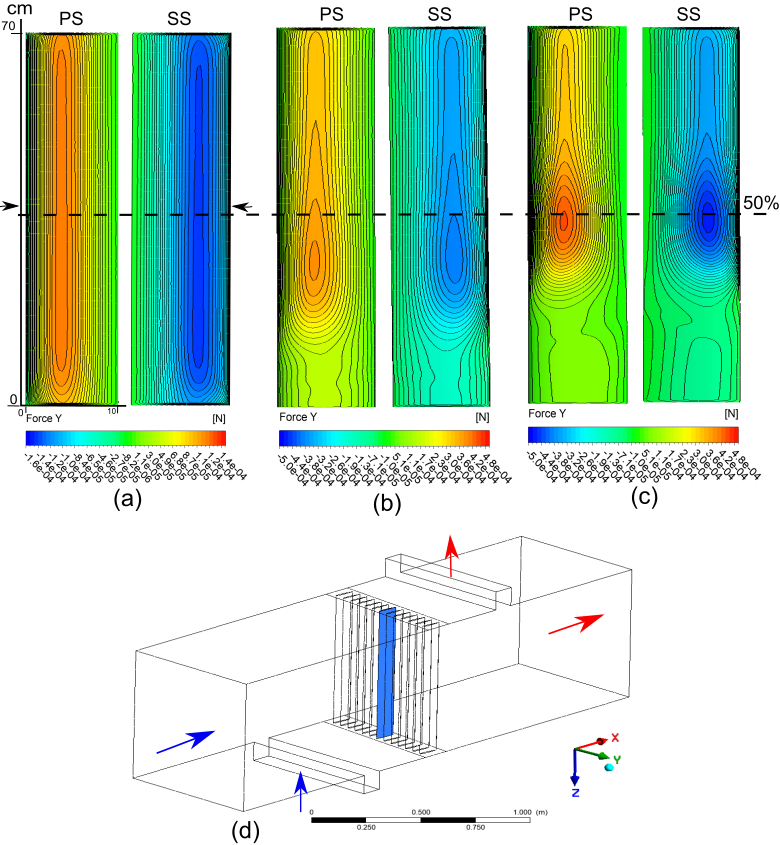
Figure 2 – The contour plot of Force ( lift) distribution on the mid blade of 3D cascade for 5m/s mainflow at aoa 5 degrees for different bypass (BP) velocities (a) Inlet 5m/s and BP velocity 0 m/s (b) Inlet 5m/s and BP velocity 5 m/s ( c) Inlet 5m/s and BP velocity 10 m/s. (d) Schematic diagram of the test section